Create charts in Angular with Chart.js

I have a deep understanding of technical concepts and an ability to adapt my writing style to various audiences. With a keen attention to detail and a commitment to accuracy.
Using graphs might be helpful if your web application contains a lot of data; you need to find a way to present it in an understandable and well-organized manner. Graphs are essential elements of user interfaces that tabulate enormous amounts of data and facilitate user interaction. Users may understand what is happening in the web applications by graphically visualizing data.
Angular is a JavaScript framework that is open-source and developed in TypeScript. It is maintained by Google, and its main use is to create single-page applications. Angular is a complete model-view-controller (MVC) framework. It supports bi-directional data flow while offering real DOM and clear instructions on how the application should be set up.
Chart.js is an open-source, configurable JavaScript chart framework used for building dynamic and intuitive representations for web applications. Many well-liked JavaScript frameworks, such as Angular, support Chart.js integration. Numerous responsive and versatile charts that can display on multiple screens are available. The following charts are supported: Radar charts, polar area charts, bubble charts, scatter charts, line charts, bar charts, and doughnut charts.
ng2-chart is a wrapper for the chart.js library. It supplies the baseChart directive to display the chart in Angular apps.
Outline
Prerequisites
Creating the Angular Project
Create Chart Component
Conclusion
Prerequisites
You'll need the following to follow along with this tutorial:
Node.js installed on your computer. If you don't already have it installed, you may get it from the Node.js website.
Fundamental understanding of Angular. You can check out Angular docs.
A text editor such as Visual Studio Code or any of your choice.
Creating the Angular Project
To create an angular project you need to have the angular CLI installed.
The Angular CLI is a command-line interface tool that you use to initialize, develop, scaffold, and maintain Angular applications directly from a command shell.
Utilizing the npm package manager, you install the CLI with this command:
npm install -g @angular/cli
Navigate to your preferred directory; use the commands below to create and serve an Angular project:
ng new angular-chart --style=css --routing=false
cd angular-chart
ng serve
This will put up a new Angular project with no routing and styles set to "CSS" (rather than "Sass," "Less," or "SCSS").
Launch your browser and navigate to http://localhost:4200/ to see the new app in action just like below.
In the terminal, still in the app directory, use the command to install the necessary dependencies namely chart.js and ng2-charts:
npm install ng2-charts chart.js
You have created the Angular project and installed all necessary dependencies. Open the project on your desired editor, at the root module which is the app.module.ts, and import the `NgChartsModule` so that module becomes available for use.
import { NgModule } from '@angular/core';
import { BrowserModule } from '@angular/platform-browser';

import { AppComponent } from './app.component';
import { NgChartsModule } from 'ng2-charts';

@NgModule({
  declarations: [
    AppComponent
  ],
  imports: [
    BrowserModule,
    NgChartsModule
  ],
  providers: [],
  bootstrap: [AppComponent]
})
export class AppModule { }
Next, you have to proceed to create the chart component.
Create Chart Component
Use the Angular CLI to create a new component in the app directory where you will set up the chart.
Execute the ng generate component <component-name> command in the terminal where <component-name> is the name of the component.
The following is what this code generates by default:
a folder with the component's name in it
A template file,
<component-name>.component.htmlA TypeScript file,
<component-name>.component.tsA CSS(or "Sass," "Less," or "SCSS") file,
<component-name>.component.cssA testing specification file,
<component-name>.spec.ts
ng generate component charts
You can change charts to your desired component name.
In the charts.component.ts file, import ChartConfiguration from the chart.js as so:
import { ChartConfiguration } from 'chart.js';
As shown below, we will construct chart data; for the demonstration utilizing static data.
export class ChartsComponent {
public barChartData: ChartConfiguration<'bar'>['data'] = {
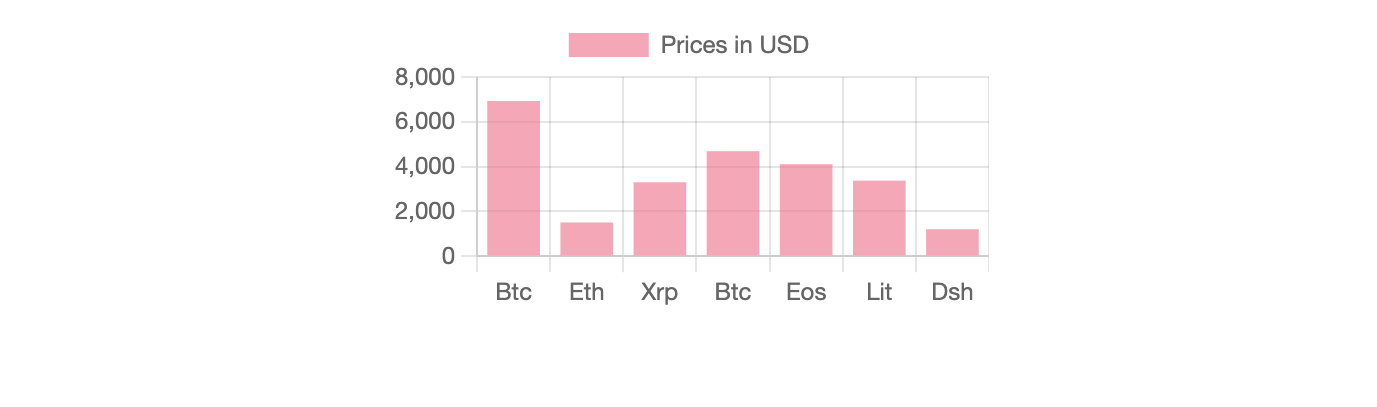
labels: [ 'Bitcoin', 'Ethereum', 'XRP', 'Bitcoin Cash', 'EOS', 'Litecoin', 'Dash' ],
datasets: [
{ data: [ 6929.82, 404.97, 0.42, 688.86, 6.98, 73.34, 202.67 ], label: 'Prices in USD' }
]
};
}
Datasets: This should be an array of objects containing data arrays and labels for each data collection.
Proceed to configure chart options as necessary, like shown
....
public barChartOptions: ChartConfiguration<'bar'>['options'] = {
    responsive: false,
  };
...
Here only one parameter is passed in the option, you can pass multiple options for more customization. This charts.component.ts now looks like this:
export class ChartsComponent {
    public barChartData: ChartConfiguration<'bar'>['data'] = {
        labels: [ 'Bitcoin', 'Ethereum', 'XRP', 'Bitcoin Cash', 'EOS', 'Litecoin', 'Dash' ],
        datasets: [
          { data: [ 6929.82, 404.97, 0.42, 688.86, 6.98, 73.34, 202.67 ], label: 'Prices in USD' }
        ]
      };
public barChartOptions: ChartConfiguration<'bar'>['options'] = {
    responsive: false,
  };
}
Now, to display the chart on the page, we utilize the canvas element together with the baseChart directive provided by ng2-chart.
In the charts.component.html, add the canvas element and pass the necessary parameters to create the chart.
<canvas baseChart
        [data]="barChartData"
        [options]="barChartOptions"
        [legend]="true"
        [type]="'bar'">
</canvas>
data: This should be an array of objects containing data arrays and labels for each data collection.
options: An object that provides options for the chart.
legend: A boolean value indicating whether or not the chart's legend should be visible.
type: This determines the chart's basic type. It can be any of the eight chart types supported.
Save the file, and view the created chart on the browser.
You can find the source code in this repo.
Conclusion
In this article, you created a simple chart in an Angular application using Chart.js and ng2-charts.
These libraries work together to give you the ability to deliver data in an up-to-date, dynamic manner.
You can learn more about Chart.js and all the features it offers in Chart.js docs.


